Since their introduction in 2009, planetary boundaries have become a widely used way of defining limits for the processes that keep the Earth system stable. This includes both cycles of nitrogen (N) and phosphorus (P).
Yet for these two nutrients, the question of what to measure has never been settled. Boundaries have been set for fertilizer inputs, for total agricultural inputs and, more recently, for nutrient surpluses, producing estimates that are difficult to compare. A newer split between “safe” boundaries – protecting ecosystems – and “just” boundaries – protecting people – has added a further layer.
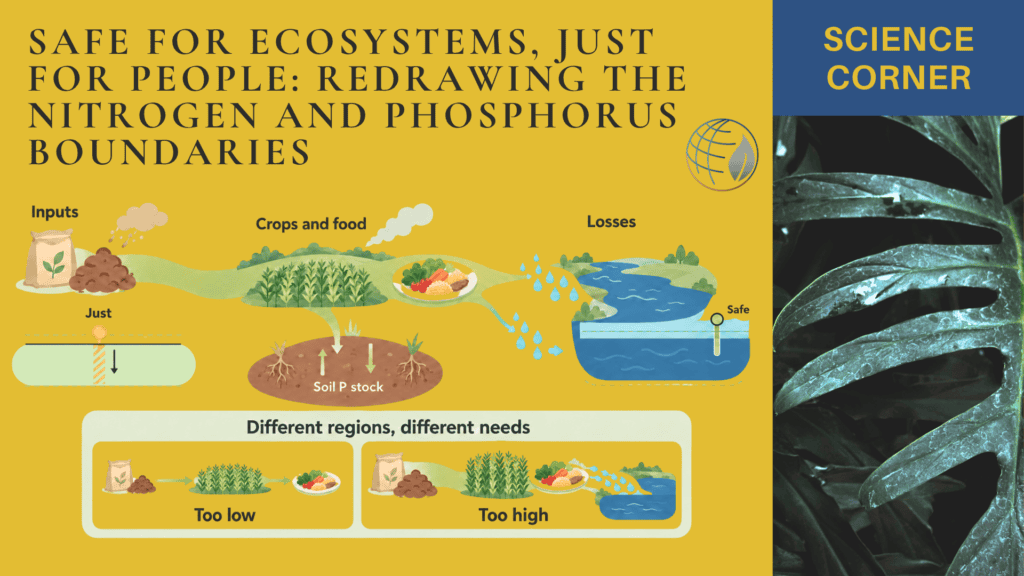
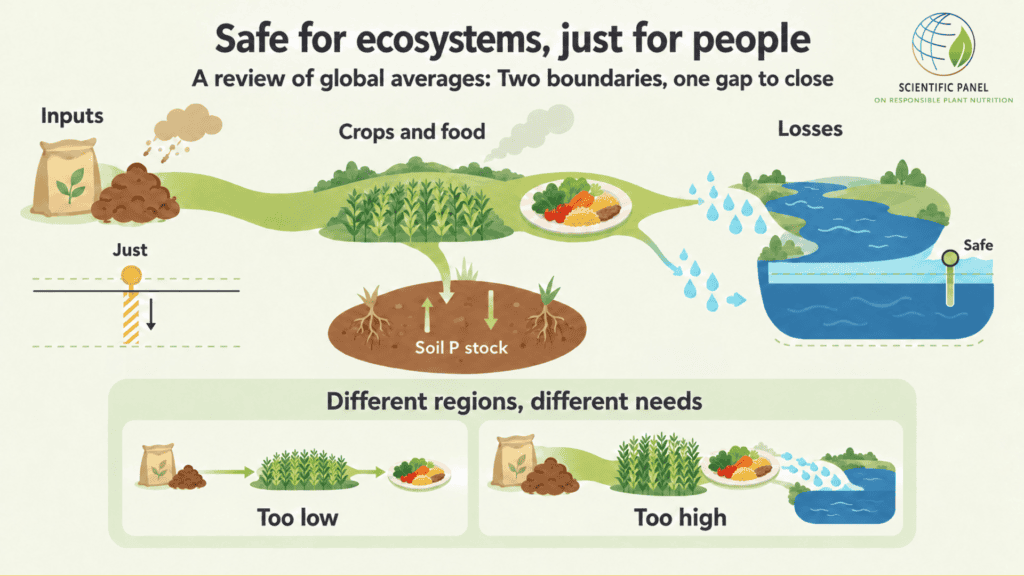
In a review in Current Opinion in Environmental Sustainability, de Vries, Schulte-Uebbing, Beusen and te Wierik take stock of these approaches and propose a cleaner division: safe boundaries should be expressed as nutrient losses to the environment, while just boundaries should be expressed as the nutrient inputs needed to feed everyone.
Why the choice of indicator matters
Unlike greenhouse gases, N and P act mostly regionally. In many regions, crop yields reach only one-half to one-quarter of their potential because nutrient inputs are too low; elsewhere, inputs far exceed crop needs and degrade the environment. The authors therefore argue that boundaries should first be derived regionally and only then aggregated. They note that a global figure implicitly assumes inputs are optimally allocated across regions.
Inputs and surpluses (inputs minus nutrients removed in harvest) are practical to manage, but their link to actual harm is complex. How much surplus N reaches water depends on denitrification — the microbial conversion of nitrate into N gases — which varies with land use, climate, soil texture, and soil organic carbon. The authors conclude that the most suitable control variables (the quantities a boundary is expressed in) are N losses — delivery to surface water, nitrate leaching to groundwater, and ammonia emissions to air — and P delivery to surface water.
A new safe boundary for phosphorus
P reaches rivers and lakes mainly through erosion, so its losses depend on erosion rates and soil P content, including legacy P built up by decades of fertilization. Combining a global water discharge of 38,000 km³/yr, a critical P concentration of 75 mg/m³ and a river P retention of 53%, the authors calculate a critical global P delivery to surface water of 6.1 teragrams (Tg; million tonnes) P/yr. This represents about 37% below the estimated 9.7 Tg P/yr delivered in 2015.
The same calculation for N gives 76–190 Tg N/yr, which the authors consider far too lenient, as it would let every water body fill up to the threshold. Earlier work by the team focusing on agricultural regions put the boundary at just 21 Tg N/yr.
The food system, including agriculture, aquaculture, and human wastewater, accounted for 71% of the N load and 74% of the P load to surface water in 2015. It also contributed just over 50% of reactive N deposited on forests and about 81% of N leaching from land.
From losses to surpluses and inputs
Using a stepwise approach, critical losses can be translated into critical agricultural N surpluses and then, via nitrogen use efficiency, into critical inputs. Drawing on a previous global analysis by Schulte-Uebbing and colleagues, the review reports a combined N surplus boundary of 57 Tg N/yr, roughly half the actual 119 Tg N/yr surplus of 2010, with an uncertainty of around 50%.
The corresponding boundary for total N inputs is 134 Tg N/yr, against a current 232 Tg N/yr. Surface water quality was the most constraining criterion in most regions, even at a critical concentration of 2.5 mg N/L. Yet, the authors consider these numbers appropriate for rivers but too lenient for lakes.
These figures assume non-agricultural losses stay constant. Wastewater currently delivers about 12 Tg N and 1.7 Tg P per year to surface waters, so cleaning it up would leave more room for agriculture.
For P, the safe input is only weakly tied to losses, because losses depend mainly on soil P status rather than on the year’s application. The authors estimate a safe total P input of about 20 Tg P/yr, roughly half of the current ~40 Tg P/yr.
Rethinking what “just” means
Recent assessments defined just boundaries around preventing human harm; toxic algal blooms, fishery collapse, ammonia-derived air pollution, and nitrate in drinking water. The authors argue these harms belong under safe boundaries, and that a just boundary should reflect the essential role of N and P in producing food. They also consider one previous estimate (30.1 Tg N and 4.9 Tg P for 2050) flawed, as it implicitly assumes 100% efficiency along the entire food chain.
Their alternative multiplies population by recommended dietary intake and divides by food-chain use efficiency. We can consider that 9 billion people eat 3 kg N per person per year at the current food-chain nitrogen use efficiency of about 17%. This gives 163 Tg N/yr.
Actual inputs are far higher, about 264 Tg N/yr in 2010, including grassland. This is a different measure from the 232 Tg N/yr above, which covers total agricultural N inputs (fertilizer, manure, N fixation, and N deposition). Average intake is about 4.5 kg N per person, 50% above the recommendation. Raising food-chain nitrogen use efficiency to 25% would lower the just boundary to 108 Tg N/yr, below the safe input boundary of 134 Tg N/yr. For P, an intake of 0.5 kg per person and a 25% phosphorus use efficiency yields 18 Tg P/yr.
Phosphorus has a different lever
Because P accumulates in soil, the authors highlight a “build-up or mining and maintenance” strategy:
- Build up soil P where it is deficient, as in much of Africa
- Draw down legacy P where it is excessive, parts of Western Europe and China
- Replace only what harvests remove
Under such management, field-level phosphorus use efficiency can approach 100%, and the authors see a food-chain phosphorus use efficiency of 33% as a realistic ceiling.
As such, this is a review and opinion piece rather than a new empirical study. The new P boundary rests on a single global calculation using average discharge, concentration, and retention values; an approach the authors themselves note cannot capture the regional variation they argue is essential.
The N boundaries draw largely on one earlier modelling study by members of the same team, carry around 50% uncertainty, and exclude nitrous oxide and nitrogen oxides. The just boundaries also assume everyone eats exactly the recommended amount.
The review suggests that feeding the world within safe N and P boundaries is possible, but not through a single fix. It will take higher nitrogen use efficiency and phosphorus use efficiency through better application and recycling, improved wastewater treatment, erosion control, and dietary change; levers that sit squarely within the principles of 4R Nutrient Stewardship and the efficiency indicators described in our Issue Brief on nutrient use efficiency.
Perhaps the paper’s most useful contribution is conceptual: by separating what the environment can tolerate from what people need, it turns a single contested number into a gap that can be measured and closed.