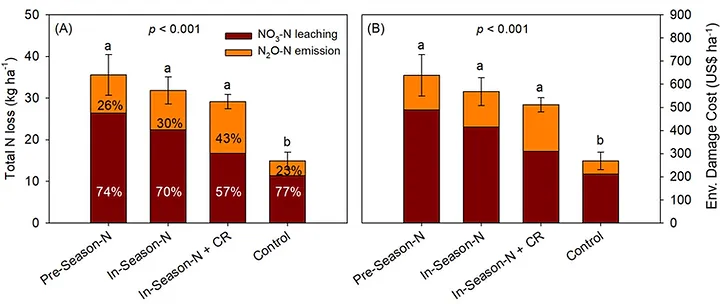
Few studies have addressed whether in-field practices to reduce nitrate leaching might actually increase nitrous oxide (N2O) emissions, which could undermine attempts to mitigate agricultural nitrogen (N) pollution. Here, the authors assess the impacts of N application timing and cereal rye cover cropping on nitrate leaching and N2O emissions over a 3-year period. They quantify changes in total N loss and corresponding social and environmental damage costs under continuous corn cropping.
While nitrate losses were reduced by 37% with the combination of in-season split N application and cover crop relative to pre-season N application, soil N2O emissions increased by 26%, highlighting a tradeoff between N loss pathways. As a result, total N losses and environmental damage costs from each system were not significantly different. These results demonstrate the importance of addressing agricultural N management using a holistic framework that accounts for the environmental and social risks of different nutrient losses.
The study illustrates another common problem: although there appears to be a decrease in N loss and environmental cost (see Figure) by applying in-season N and cover cropping, it is not ‘detectable’ (not statistically significant) with the experimental approaches that are widely used. Many of the innovations that are being pursued in crop nutrition will only have relatively small effects on indicators such as yield, nitrogen use efficiency, specific N losses, economics etc. We will need more standardized, coordinated performance evaluation solutions that also include novel designs, measurements and data analysis methods that may help us detect such small effects more precisely.